
Carvana: Feedback Loops

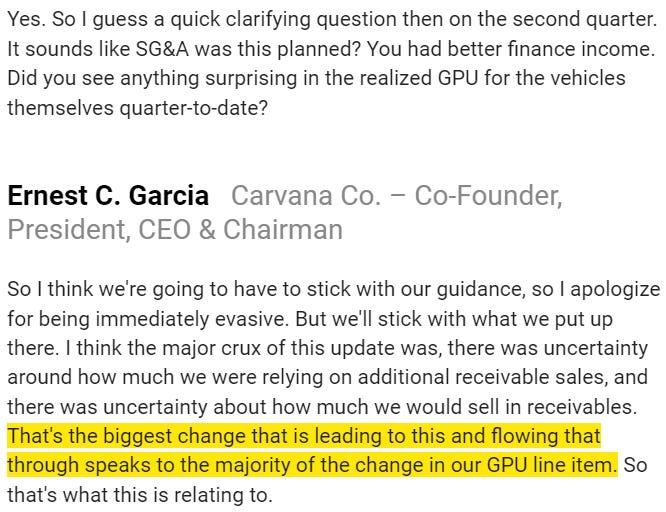
On Thursday of last week, Carvana raised its outlook for its second quarter. Ernie spoke at the William Blair conference on the same day to explain.
Second-quarter adjusted EBITDA increased from “positive” previously to “above $50 million” while non-GAAP GPU went from “above $5,000” to “above $6,000.” The “majority” of the non-GAAP GPU improvement is the result of selling down a large chunk of the elevated backlog of loans during the quarter. The “majority” language that Ernie used at the conference seemed to imply a minority of the improvement was attributable to something else, likely better retail GPU as a result of falling average days to sale.
Bears and skeptics point out the non-recurring nature of the loan sales, which is, of course, correct. Carvana could have either sold down the loan backlog quickly, in which case there would be a brief surge in Other GPU, or more gradually, in which case Other GPU would remain somewhat elevated for a longer stretch. Carvana chose the former as market conditions have been favorable.
But pointing out non-recurring nature of the loan sales to try to suggest meaningful progress isn’t being made is missing the forest from the trees. Of course non-GAAP GPU should normalize lower from this second-quarter spike as the pace of loan sales normalizes. But so what? Carvana doesn’t need to sustain greater than $6,000 non-GAAP GPU to be successful. $5,000 or greater, which I think will be a sustainable level, would be fantastic in conjunction with non-GAAP SG&A per unit likely falling below $5,000 this quarter and eventually below $4,000. Again, the spread between non-GAAP GPU and non-GAAP SG&A per unit can be called cash contribution per unit or adjusted EBITDA per unit. Multiply that by retail unit volume and we have adjusted EBITDA, which while not at all true cash flow can be considered the key building block towards it.
In the second quarter, I think we might see something like…
[Note: You’ve read less than 15% of this post so far. There are two ways to read the rest:
1) Subscribe to the original Implied Expectations, which costs $300 per year for a paid subscription. If you are ok with screenshots of my scenario analysis and valuation models, this is a good option.
2) Subscribe to IE with Models, which you’re reading right now, which costs $500 per year for the paid subscription. The only difference is most of the valuation-focused posts come with a link to the downloadable Excel models so you can play around with the assumptions yourself.]